

About 60% to 80% (published range 54% to 82%)
COD share of Moroccan online orders
Conservative segment-level reporting puts COD near 60%, while sector trackers report 75% to 82%; treat as a range.
20% to 30%
Return-to-origin rate on COD parcels
Reported sector band for COD operations, driven by unconfirmed orders and doorstep rejection.
540 billion MAD at end-July 2026
Currency in circulation, Morocco
Bank Al-Maghrib monetary statistics; the stock has more than doubled in six and a half years.
Fewer than 14 of every 100 dirhams on a card fund a purchase
Card payments versus withdrawals, 2024
192.5 million payments worth 63 billion MAD against 401 million withdrawals worth 403 billion MAD.
Data snapshot on cash-on-delivery in Moroccan e-commerce: COD share of orders, return-to-origin rates, unit cost per delivered parcel, and how Morocco compares with Egypt, Turkey and the UAE.
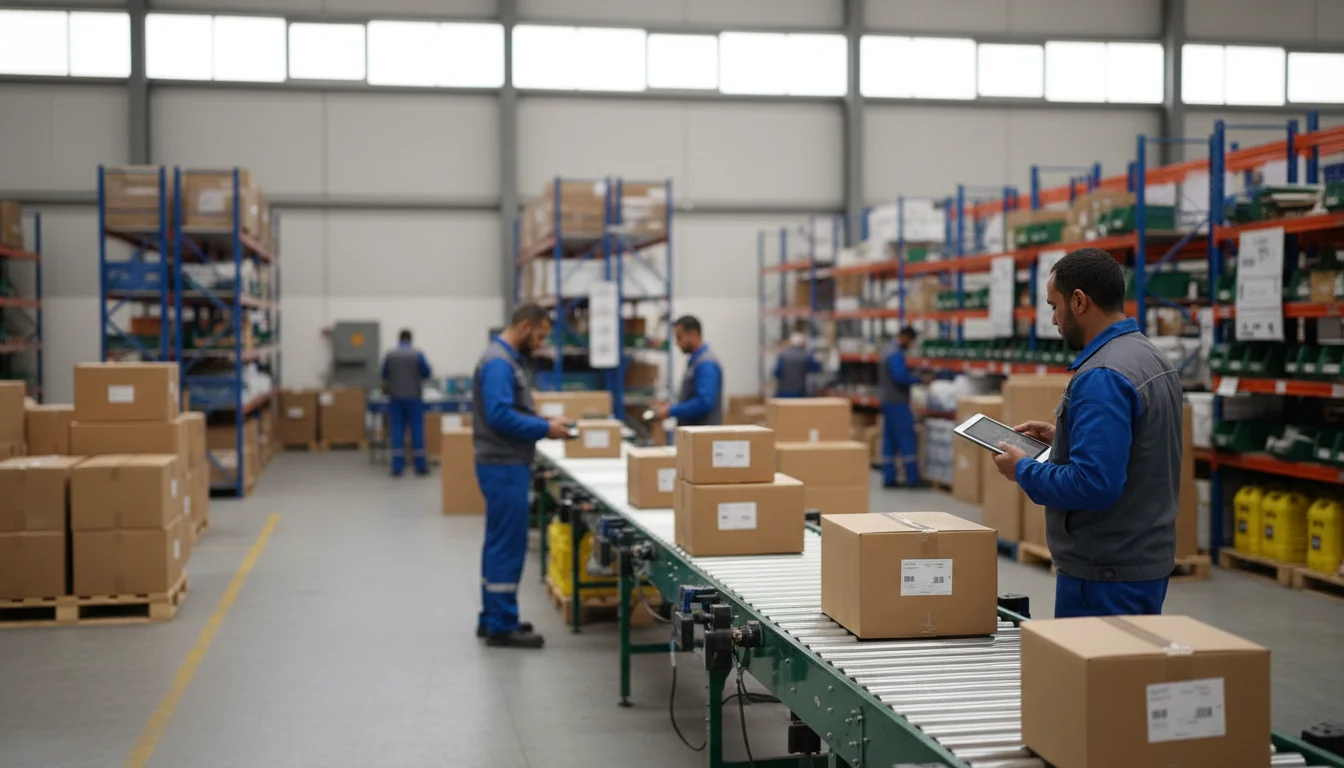
Key Metric: COD Still Settles the Majority of Moroccan Online Orders
Direct answer: cash on delivery remains the settlement default in Moroccan e-commerce. Published 2026 estimates cluster between roughly 60% and 80% of online orders, which places Morocco closer to Egypt than to Turkey or the UAE, where prepaid card and wallet checkout dominates. The most conservative recent figure available puts COD at about 60% of total orders in specific retail segments, while sector trackers report higher bands of 75% to 82%.
The macro backdrop explains why the number is sticky. In 2024, Moroccans made 192.5 million card payments totalling 63 billion dirhams, against 401 million withdrawals totalling 403 billion dirhams, meaning that out of every 100 dirhams spent using a Moroccan bank card, fewer than 14 are used for payments. At the same time, currency in circulation reached 540 billion dirhams at end-July 2026 according to Bank Al-Maghrib, more than doubling in six and a half years (roughly EUR 49 billion or USD 57 billion at prevailing rates).
Digital rails are nonetheless scaling. Online transactions are projected to exceed 13.55 billion dirhams (about USD 1.43 billion) across more than 55.4 million operations by the end of 2026, following a 2024 baseline of 38.5 million transactions worth 11 billion dirhams. For operators, the practical consequence is that the cash-on-delivery cost stack, not demand generation, is the binding constraint on margin.
- Cash on delivery still settles an estimated 60% to 80% of Moroccan online orders, with published bands as wide as 54% to 82%, placing Morocco closer to Egypt than to Turkey or the UAE.
- Return-to-origin rates of 20% to 30% on COD parcels, not post-delivery refunds, are the single largest profitability variable in Moroccan e-commerce.
- On an illustrative 300 MAD basket, COD fulfilment plus collection costs roughly 62 MAD per delivered order versus about 39 MAD prepaid, a gap of some eight points of order value.
- The macro context is entrenched cash use: currency in circulation reached 540 billion dirhams at end-July 2026 and fewer than 14 of every 100 dirhams passing through a Moroccan card fund a purchase.
- Tax verification of around 80 e-commerce operators and new capital entering merchant payment acceptance are both reducing the historic cost advantage of untraced cash settlement.
About 62 MAD vs. 39 MAD on a 300 MAD basket
Illustrative cost per delivered order, COD vs. prepaid
Indicative scenario only, assuming 25% RTO on COD, 3% collection commission and 30 MAD forward last-mile cost.
Regional Benchmark: Morocco vs. Egypt, Turkey and the UAE on COD Share and Returns
The table below benchmarks Morocco against three regional reference markets. The Morocco column is grounded in published 2026 sector data; the Egypt, Turkey and UAE columns are indicative directional bands, not survey-grade measurements, and should be treated as a framing device rather than a hard dataset.
| Metric | Morocco (published 2026 estimates) | Egypt (indicative) | Turkey (indicative) | UAE (indicative) |
|---|---|---|---|---|
| COD share of online orders | 60% to 80% (published ranges span 54% to 82%) | 50% to 70% | Below 20% | Below 15% |
| Card share of online checkout | About 12% to 18% | Minority of checkout | Majority of checkout | Large majority of checkout |
| Return-to-origin rate on COD parcels | 20% to 30% | 20% to 30% | 10% to 20% | Below 10% |
| Mobile share of online orders | 72% to 85% | High | High | High |
| Fulfilment plus payment cost per delivered order (illustrative, % of average order value) | About 21% on COD vs. about 13% prepaid | Comparable to Morocco | Materially lower | Lowest of the four |
Two grounded data points anchor the regional comparison, and they do not agree. One sector compilation reports that COD accounts for more than 80% of B2C transactions across Saudi Arabia, the UAE, Egypt and Jordan, while another states that COD preference across MENA has halved from 41% to 20% over 48 months. The divergence is almost certainly definitional: the first measures transaction mix across a cash-heavy market set, the second measures stated consumer preference in surveys weighted toward Gulf markets. Investors should insist on knowing which of the two a vendor is quoting before underwriting a business plan.
On returns, the operative benchmark is return-to-origin rather than post-delivery returns. Sector guidance places RTO rates at 20% to 30% on COD operations, a level that dwarfs the refund rates typical of prepaid European or Gulf checkout. High RTO driven by unconfirmed orders, failed deliveries or doorstep rejection can severely impact profitability, which is why confirmation call centres and address-quality scoring are treated as core infrastructure in Moroccan D2C rather than as optional overhead.
Ticket size matters for the same reason. Indicative figures place average COD order value at 200 to 350 dirhams, slightly higher for prepaid orders, or roughly EUR 18 to EUR 32. A fixed last-mile cost absorbed against a 300 dirham basket behaves very differently from the same cost absorbed against a Gulf basket several times larger, which is the structural reason Moroccan COD unit economics sit closer to Egypt than to the UAE. Finally, market-size estimates for Morocco diverge widely, from about USD 1.66 billion in 2025 to figures above USD 2 billion elsewhere, so any sizing exercise should be run as a range, not a point estimate.
Interpretation: What Actually Keeps Cash on Delivery Dominant
The persistence of COD is not a technology gap. Payment accounts, cards, mobile wallets and instant transfers are all in place, and adoption is growing: active mobile wallets rose from 10.4 million to 13.7 million in a single year according to Bank Al-Maghrib's 2024 annual report, close to 32% growth, while more than 215 million card transactions worth about 90 billion dirhams were recorded in 2024, with contactless representing nearly three quarters of operations.
Three drivers explain the gap between instrument availability and checkout behaviour. First, trust and transaction cost. As observers of the Moroccan payments market put it, trust is the overarching explanation, and cash seems free whereas merchants pay around 1% in fees on a card terminal. Second, cash supply remains abundant and convenient: the pandemic's precautionary hoarding effect, the weight of informal activity, diaspora transfers converted into cash, and a confidence deficit in institutional financial channels all reinforce the cycle. Bank Al-Maghrib itself frames the trend carefully, noting that rising cash in circulation coexists with parallel growth in electronic payments and reflects structural reliance on cash rather than a decline in digital usage.
Third, last-mile and reverse-logistics quality. Coverage outside the Casablanca, Rabat and Marrakech corridors is thinner and costlier, and returns management is less developed than in Gulf markets, a point echoed in academic work on e-commerce impact that identifies logistics costs as a core variable. COD is therefore both a symptom of low payment trust and a substitute product guarantee: the consumer inspects before paying.
Two 2026 developments are shifting incentives. Reporting by TelQuel and other Moroccan outlets indicates that tax authorities have begun verifying the accounts of around 80 e-commerce companies and traders following data pointing to discrepancies between declared revenue, COD sales and recurring bank transfers made by delivery companies to online sellers. In parallel, capital is flowing into proximity payment acceptance: electronic payments operator VPS has welcomed AfricInvest's FIVE fund into its capital to accelerate terminal acquiring and SoftPOS alongside its e-commerce solutions, while ORA Technologies is consolidating delivery, cash and marketplace assets into a single ecosystem. Both trends compress the historic cost advantage of untraced cash.
Investment Implications: Underwriting COD Unit Costs and Working Capital
For anyone allocating capital to Moroccan e-commerce, logistics or payments, COD should be modelled as a cost line with an embedded working-capital charge, not as a payment preference. The scenario below is an illustrative construction using the published ranges cited above (average order value of 300 MAD, roughly EUR 27 or USD 32; a 25% return-to-origin rate on COD and 5% on prepaid). It is a modelling template, not a market observation.
| Per 100 parcels shipped, AOV 300 MAD (illustrative) | COD | Prepaid |
|---|---|---|
| Orders successfully delivered | 75 | 95 |
| Forward last-mile cost at 30 MAD per parcel | 3,000 MAD | 3,000 MAD |
| Return-to-origin cost at 20 MAD per returned parcel | 500 MAD | 100 MAD |
| Collection cost (3% COD commission vs. 1.5% gateway) | 675 MAD | 428 MAD |
| Order confirmation and contact centre | 500 MAD | 200 MAD |
| Total fulfilment plus payment cost | 4,675 MAD | 3,728 MAD |
| Cost per delivered order | About 62 MAD (USD 6.5) | About 39 MAD (USD 4.1) |
| Share of 300 MAD order value | About 21% | About 13% |
The spread, roughly 23 MAD (about EUR 2.1 or USD 2.4) per delivered order, equates to some eight points of gross margin. On a catalogue carrying 35% to 40% gross margin, that is the difference between a scalable operation and one that funds its own growth out of equity. Three underwriting consequences follow.
Working capital is the hidden line item. Cash collected at the door sits with the carrier before remittance, and manual tracking and reconciliation of carrier-collected cash can cause significant cash-flow delays and accounting errors. Diligence should test the actual remittance cycle in days, the reconciliation tooling, and the carrier's balance-sheet capacity to hold merchant cash.
Returns are a pricing problem, not an ops problem. Moving RTO from 25% to 15% in the scenario above is worth more than any negotiated discount on last-mile tariffs, which argues for investment in confirmation workflows, address data quality and partial prepayment incentives.
Compliance risk now carries a number. With tax verification focused on COD receipts and delivery-company transfers, undocumented cash flows are a valuation discount rather than a margin advantage. Investors structuring entries should pressure-test reconciliation trails and VAT treatment early; our teams address this through risk management and compliance and financial advisory and structuring work. The investable exposures sit less in generic online retail and more in payment acceptance for small merchants, COD reconciliation software, reverse-logistics capacity and consolidated delivery platforms.
Conclusion and Next Steps
Morocco is a cash-on-delivery market in slow transition, not a prepaid market in waiting. COD plausibly still settles 60% to 80% of online orders, return-to-origin runs at 20% to 30%, and the illustrative cost gap versus prepaid checkout is around eight points of order value. At the same time, digital transaction volumes are projected to exceed 55 million operations and 13.55 billion dirhams in 2026, fiscal scrutiny of COD receipts is rising, and fresh capital is entering merchant payment acceptance. That combination narrows the window in which COD-first operating models enjoy a structural cost edge.
Investors and operators should size the opportunity as a range, model COD explicitly, and stress-test remittance cycles before committing capital. For a market-specific view, see our market research and intelligence and investment strategy and planning services, run your own assumptions through the investment simulator, or contact our research desk for a tailored benchmarking note. This analysis is informational and not financial advice.

The information provided by Smart.by on the website www.smartbyllc.com is for informational purposes only and does not constitute financial advice. Please contact us to learn more.
Financial Insights, News & Resources
Trusted by 300+ subscribers.


Simplifying complex financial decisions through FAQs.
End-to-end investment advisory: capital allocation, risk assessment, M&A, and asset optimization, plus dedicated support for foreign investors entering Morocco, including market research, regulatory navigation, and operational setup. Every engagement is backed by Smart Flow, our real-time investment analytics platform.
High-net-worth investors, private equity and venture capital firms, and corporations expanding into Morocco and Africa. What they share is a preference for data over guesswork, and results over reassurance.
Book a consultation through our website, or call or email us directly. We'll map your objectives to a plan in that first conversation, no lengthy onboarding required.
Your investment, visible in real time. Smart Flow tracks project progress, surfaces risk before it becomes a problem, and puts financial reporting and team collaboration in one place, so you're never waiting on a quarterly update to know how things stand.
Tourism, industrial manufacturing, agribusiness, transport and logistics, automotive, and real estate: sectors we've worked in long enough to spot the risks and opportunities others miss.
Capital that's put to work deliberately, risk that's managed rather than discovered, and a market entry that doesn't stall on paperwork. Our clients measure success in returns, not activity.
Encrypted, access-controlled, and independently audited on a regular basis. Your investment data gets the same rigor as your investment strategy.
Always. We manage the asset, not just the deal: ongoing performance monitoring, risk management, and strategic adjustments as the market moves.
Subscribe to our newsletter for market insight and new opportunities as they open, or follow us on social media for real-time updates.
It's built in, not bolted on. We weigh environmental, social, and governance factors alongside financial ones, because long-term value and responsible investing aren't in competition.
Call +212 6 41 52 96 83, or visit us in Tangier, Casablanca, or Marrakech. You can also reach our team anytime through the contact page.

Still have questions before you commit?
- Talk to a consultant, not a call center
- See your numbers on Smart Flow before you decide